Zabbix is a monitoring system based on web interface which provides distrubuted system monitoring and network monitoring.Zabbix is an open-source software.It can monitor a cluster,an URL,a server,and so on.
1.How to build a Zabbix system?
First,you should prepare and build an enviorment in your server.An enviorment consists of operating system,web server,database,programming language.You can choose the operating system like Windows or Linux,web server like Apache or Nginx,database like Mysql,programming language like Php.Second,after the preparation of enviorment,you should view the official website to download the suitable package in your server and your computer.Third,install the package,Zabbix server,Zabbix frontend,Zabbix agent by the guidance of Zabbix official website and configure the database.Finally,log in the Zabbix website,and enter the Zabbix website,and set by the guidance of the Website.
2.Components
A Zabbix system mainly consists of an enviorment,Zabbix server and Zabbix agent.After the construction of enviorment,you can acquire the package form Zabbix website and input ‘dnf clean all‘ to clean the cache.Then,you can input ‘yum list‘ or ‘dnf list‘ in your command line to check the yum/dnf package.If the zabbix-server and zabbix-agent in the list,input ‘dnf install zabbix-server-mysql zabbix-web-mysql zabbix-apache-conf zabbix-sql-scripts zabbix-selinux-policy zabbix-agent‘ to install the dnf package.And then,configure your database of Zabbix.Finally,input ‘systemctl restart zabbix-server zabbix-agent httpd php-fpm‘ and ‘systemctl enable zabbix-server zabbix-agent httpd php-fpm‘ to start Zabbix server,Zabbix agent processes,then make it start at system boot.
Zabbix server is a memory pool to store the configuration data,statistic data and manipulation data.Zabbix proxy can replace Zabbix server to collect performance and availability data.Zabbix agent deployed on the monitored target to monitor local resource and program,and report collected data to Zabbix server.
3.Web page
After the registration of Zabbix,you’ll get in the monitoring page.
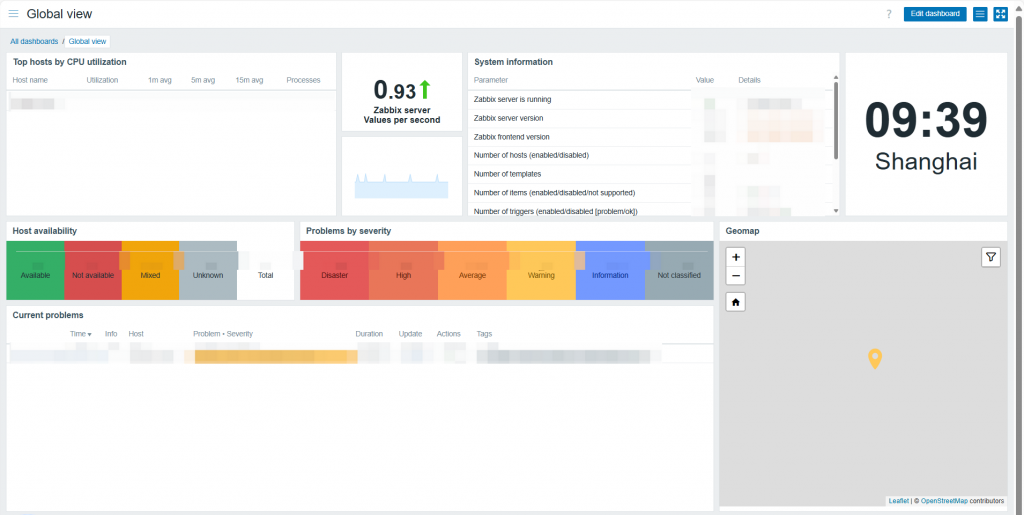
This is the homepage of Zabbix,it contains all of dashboards.You can edit dashboards to set or add users,hosts,triggers,and so on.You can check host availability,problems by severity by the dashboard.
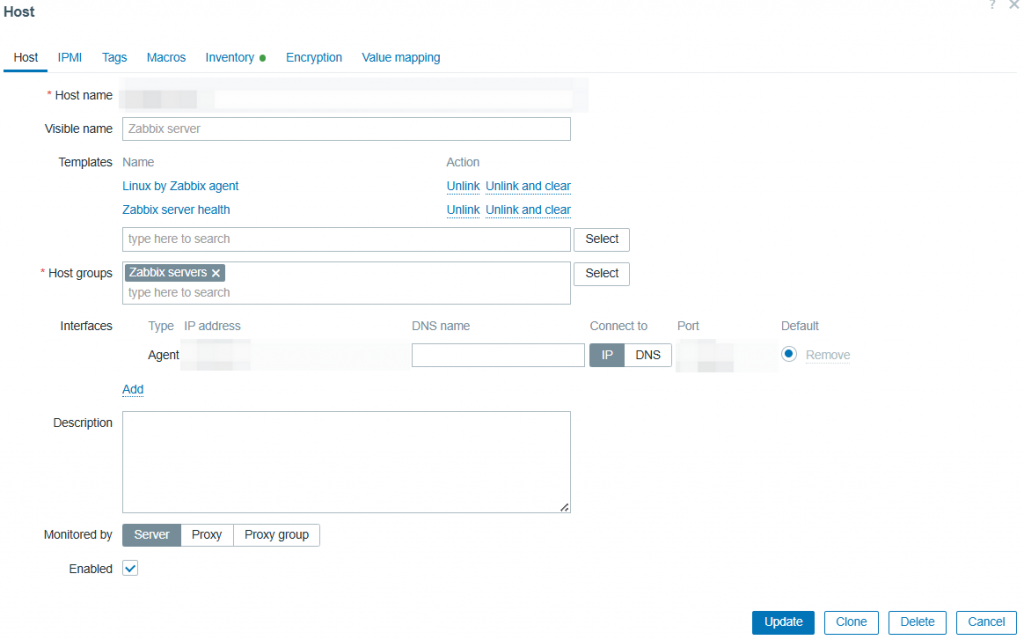
You can add or edit host name,IP address,port,DNS name,groups in the Host page. Localhost IP address is 127.0.0.1,host name is ‘localhost’.
P.S. The bold text means the file,directory or code,you can reply it in your command line.
4.Check problems
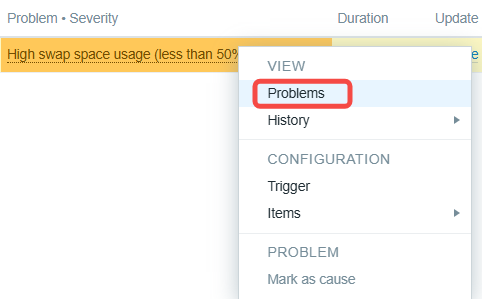
Search Current problems in the dashboard.

View problems.
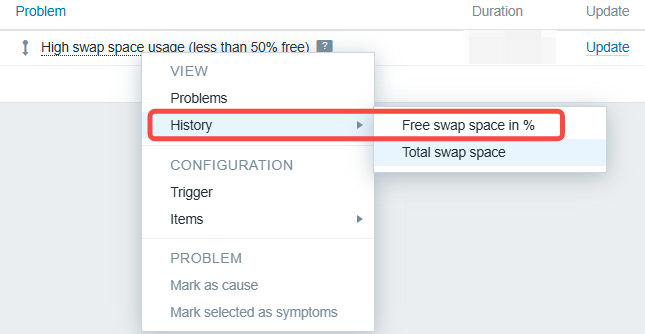
Check history graph of the host.

5.Solve Problem or Ignore It
Login in the host.Input ‘free -h’ to check it.

Depend on the requirements,solve the problem or ignore it.
6.Check Latest Data
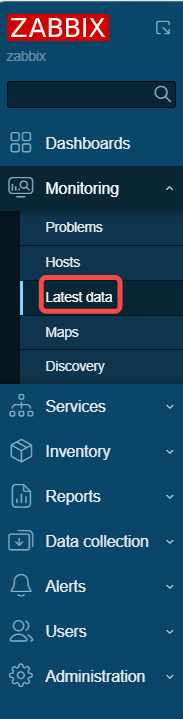
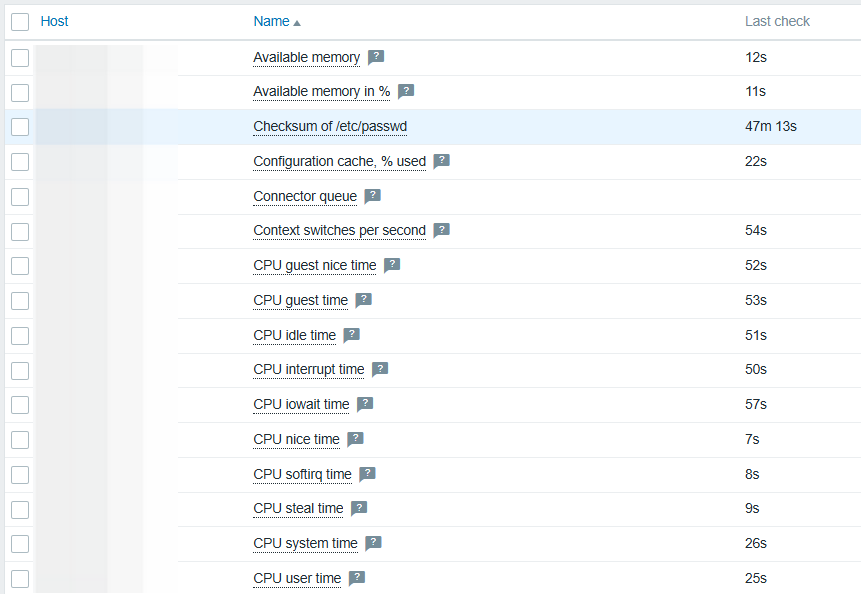
Choose ‘Available memory in %’.
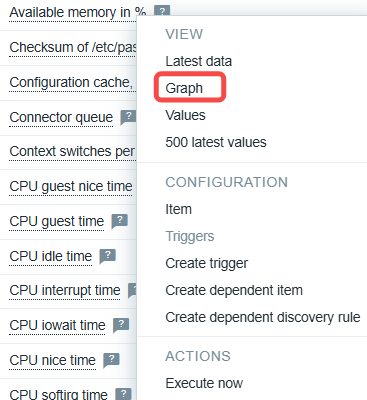
Check graph of the host.

Leave a Reply